These 13 best automated code review tools help detect code, quality and security issues automatically. They significantly reduce the human effort during code review and help you to find certain issues faster and more reliably. Automating as much as possible during code review is also a code review best practice.
We will cover the following in this article:
- Code Analysis Platforms
- Static analysis and linting tools
- Security-focused automated code review tools
Automated Code Review Tools
In this article, I will discuss some of the most popular code review automation tools like DeepSource, Synk, Codiga, or SonarCube, and explain how they can help you during code reviews. They neatly complement almost any code review tool that assists with manual code reviews like GitHub, Space or Gerrit.
While most of these tools also claim to be AI-powered, they work differently than the AI-based code review tools that use large language models such as GPT under the hood.
Code Analysis Platforms
Let’s start with what I’ll call code analysis platforms. Under the hood, code analysis platforms such as DeepSource, or Codiga, are based on the same linting and static analysis tools that you can install and use alone (like ESLint for Javascript, or Black for Python). Yet those tools offer additional functionality, like collecting quality metrics across different repositories, even if you use different technologies, and presenting them in one unified view. In addition, those tools often also add features that automatically comment on your code review and take over the configuration of a small CI/CD pipeline for you. Many of the tools also enhance the static analysis capabilities of the open-source tools they rely on or sprinkle their own homegrown AI magic on top to reduce false positives or other noise.
Coherent Configuration
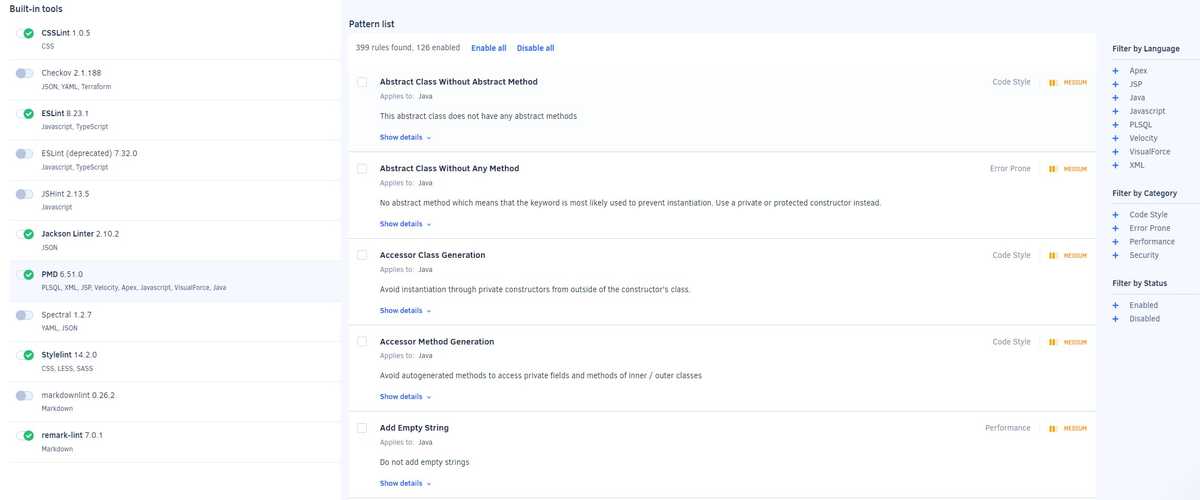
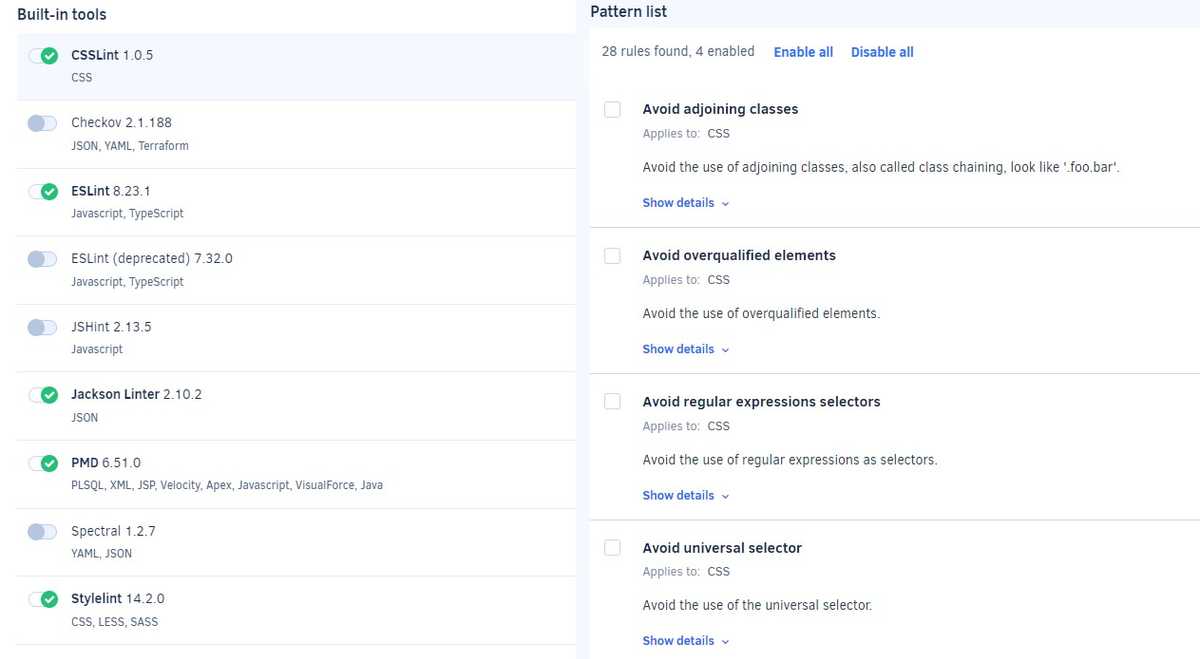
Another advantage of code analysis platforms is their ability to let you configure your analysis and the tools in one coherent interface. For example, when using Codacy, you can click on each of the tools that are executed in your analysis run, and enable or disable the rules.
For example, the screenshot below shows how you can configure PMD within Codacy. Making sure the right rules are enabled, or customized so that the tool neither overlooks issues, nor that it reports too many false positives is a time-consuming part, and often the reason why developers abandon static code analysis tools. So, help with this configuration is truly important.
Codacy
The first tool I want you to know is Codacy. It is an automated code review tool that analyzes code in a variety of programming languages, including Java, Python, and Ruby. It uses a rule-based approach to identify issues such as code smells, security vulnerabilities, and style violations. Codacy does not automatically fix the code, but it provides developers with a list of issues and recommendations on how to fix them. It works both pre-commit and post-commit, and it can comment on pull requests.
What’s neat in Codacy is that it breaks down issues into several categories, and thus helps you prioritize what to focus on. The categories Codacy looks at are Code Style, Error Prone, Performance, Security, Compatibility, Code Complexity, Documentation, and Unused Code.
Codacy is built on top of tools like PMD, ESLint, JSHint, Checkov. In the code patterns section on the tool, you can change which tools perform your analysis (for example replace ESLint with the lighter JSHint tool), as well as enable or disable rules.
While Codacy allows free analysis for open-source projects, their security scans are not free, and even open-source projects are required to pay.
Deepsource
Deepsource is another powerful code analysis platform, that has been in the news quite a bit because of its autofix feature.
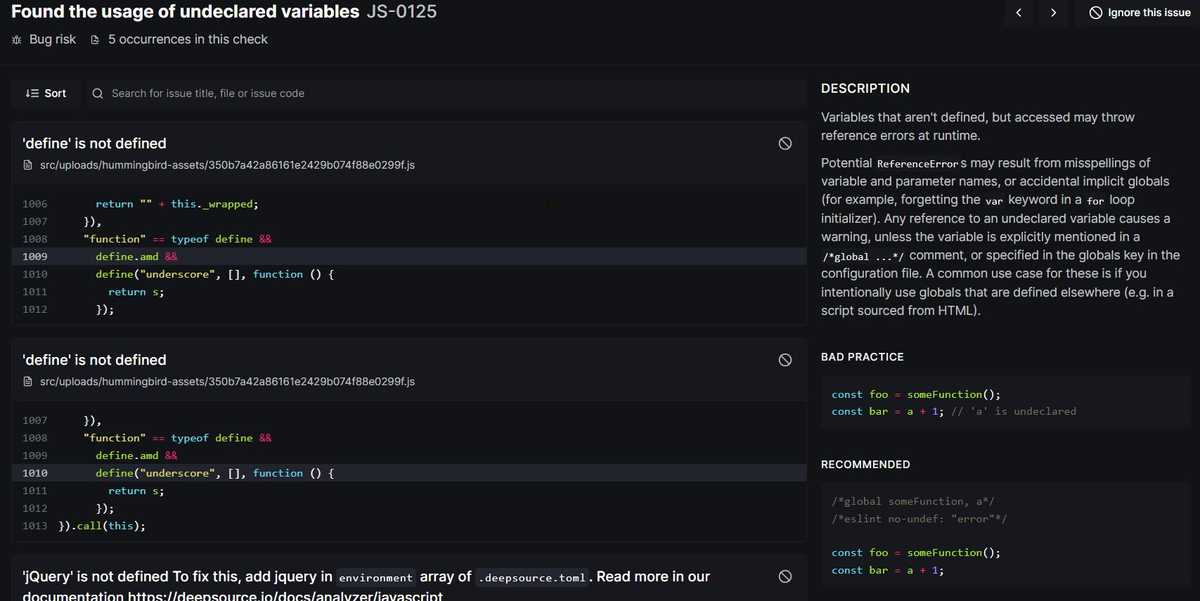
I like the tool quite a bit because of its in-depth description of the problems that it detects.
As you can see in the picture below, Deepsource not only flags different code parts but also provides,
on the right-hand side, a description of the problems and examples of “bad practice” and “good practice”.
This makes it a very nice tool also for learning and knowledge sharing.
One of the limitations of Deepsource is that it does not integrate with the IDE, nor does it provide pre-commit hooks. This limitation means that you have to wait until you push your code to the remote branch and to the PR, to get informed about potential issues.
Deepsource promises a false-positive rate of under 5%. I haven’t ever checked if that’s true, but it sounds pretty okay ;-).
Autofix Code Reviews with DeepSource
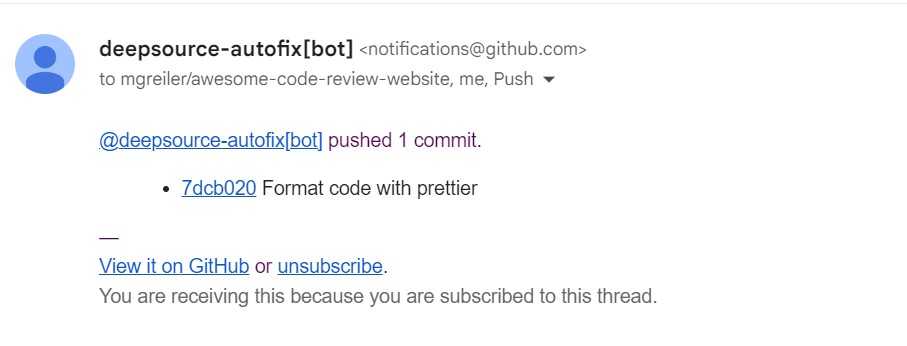
Deepsource also offers an extension that autofixes issues. For example, you can enable DeepSource to check your
code with Prettier and then let the tool automatically commit and push changes with the suggested autofixes to your branch.
Personally, I get very unsettled by those automatic changes to my code, and I disable them.
I’d recommend that you enable tools like Prettier or other linting or static analysis tools that do automatic changes already in your IDE,
or with a pre-commit hook so that you can actually see, and test your changes locally.
SonarQube
SonarQube is another very popular open-source code quality tool. It analyzes code and provides feedback on issues such as code smells, bugs, and security vulnerabilities. It uses, like most tools, a rule-based approach to analyze code and assigns a score to the code quality. SonarQube does not automatically fix the code, but rather informs developers about the issues and provides recommendations on how to fix them. It works both pre-commit and post-commit, and it can comment on pull requests.
SonarQube categorizes issues as Code Duplication, Coverage, Maintainability, Security, Reliability, Size, Complexity and Other Issues.
Similar to DeepSource, SonarQube also shows you a description of why a detected issue is a problem.
As SonarQube has a very comprehensive list of issues it looks for, it’s important to configure the tool carefully and also to create a strategy around how to deal with issues, especially technical debt.
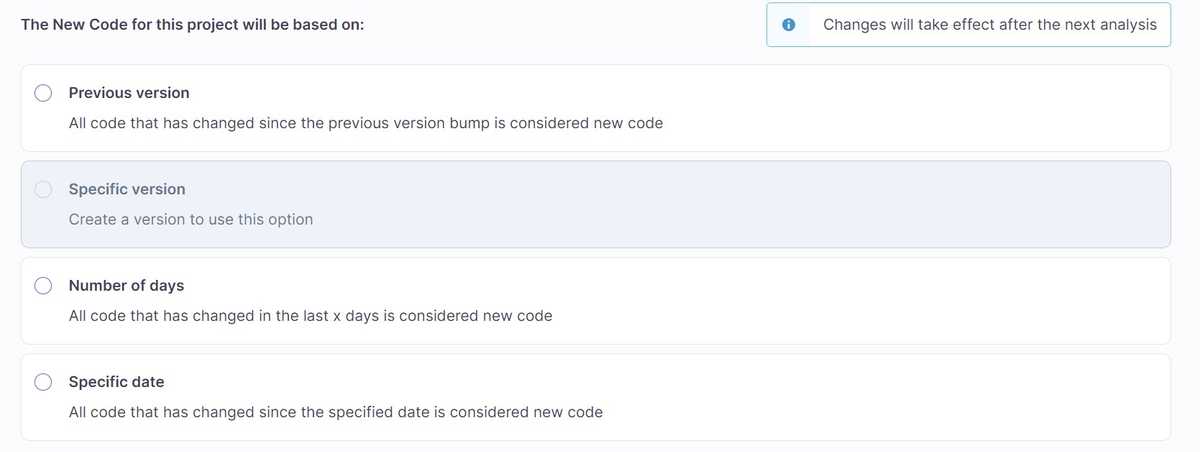
For example in the screenshot below, you see a configuration option for what is considered as new code. By doing so,
the team can limit which code that is scanned for problems. This is important to not overwhelm developers with issues in old or even stale code.
CodeClimate
CodeClimate provides automated code reviews and identifies potential issues in code, such as code complexity, code duplication, or missing test coverage. CodeClimate has a strong focus on the maintainability of code bases. Therefore, most of the checks that the platform provides are linked to test coverage, and code complexity.
It also highlights quality information with it’s relation to code churn. This allows you to prioritize fixing tech debt and quality issues in high-churn areas first. This follows the idea that high churn areas, which are areas that are changed more frequently are more error-prone, and that the payoff of fixing those areas is greater than fixing more stale code areas.
The maintainability checks of CodeClimate include detecting methods with a high argument count, complex boolean logic, code duplication, or long methods.
Another feature is the test coverage engine which allows you to check that the test coverage is always above a certain threshold; otherwise, it complains during code review.
CodeClimate works like the other tools for a large range of languages including C#, Java, JavaScript. It can create comments on pull requests offers a GitHub integration, and also offers extensions for Slack, Jira and many more tools. You can also use CodeClimate within your IDE by installing the hosted code climate CLI.
Codebeat
Codebeat is an automated code review tool that analyzes code in a variety of programming languages, including Java, Python, JavaScript, and Swift. It uses a rule-based approach to identify issues such as code smells, security vulnerabilities, and style violations. Codebeat does not automatically fix the code, but it provides developers with a list of issues and recommendations on how to fix them. It works both pre-commit and post-commit, and it can comment on pull requests.
Codegrip
Codegrip is a pretty new automated code review platform that analyzes code in a variety of programming languages, including Java, Python, and C#. It uses a rule-based approach to identify issues such as code smells, security vulnerabilities, and style violations. Codegrip does not automatically fix the code, but it provides developers with a list of issues and recommendations on how to fix them. It works both pre-commit and post-commit, and it can comment on pull requests.
Codiga
Codiga is a discontinued tool that is nowadays getting integrated into DataDog. Codiga offered customizable static code analysis, that can be used within your IDE, as pre-commit hook, or as an automated code reviewer in your CI/CD pipeline leaving comments on your PR. Hopefully, with the integration of Codiga’s functionality, Datadog will soon be using static analysis rules to detect quality issues, security vulnerabilities, performance issues, and other potential bugs.
Static analysis and linting tools
There are too many static analysis or linting tools out there to list them all. What’s important is that most static analysis tools focus on one particular language. If you use JavaScript, your static analysis tool of choice will be ESLint or the lighter version JSHLint. If you use Python, you most likely will use PyLint or Black. For Ruby code there is RuboCop, and so on. Some of those tools will only provide code formatting functionality, while others will also check for errors, or even offer automatic fixes.
Security-focused automated code review tools
Snyk
Snyk is an automated code review tool that focuses on identifying security vulnerabilities in open-source libraries and packages. Contrary to other analysis tools, this tool does not focus on the code you write but rather tells you about vulnerabilities in libraries and code you use.
Snyk statically analyzes your project to find vulnerable dependencies. The tool not only flags vulnerable dependencies (think Log4j 2.17) you may be using but also helps you fix them.
As this analyzer can run as part of your CI/CD pipeline, it keeps developers from adding new vulnerable libraries by testing pull requests and failing the test, if a new vulnerability is introduced.
You can use Synk either on your local machine, in your build pipeline, or via a web interface.
CodeQL
CodeQL is a powerful static analysis tool developed by GitHub that can be used to find security vulnerabilities and bugs in code. It works by analyzing the source code of a program and building a database of information about how the code works.
CodeQL is designed to be highly flexible, allowing developers to create their own queries to search for specific types of issues in their code. It can be used to find a wide range of issues, including buffer overflows, injection vulnerabilities, and other security vulnerabilities.
Checkmarx
Checkmarx is a commercial tool application security checking tool. It uses data flow analysis to identify potential issues in a range of programming languages, including Java, .NET, C++, Python, and PHP. It uses a proprietary analysis engine to identify issues such as SQL injection, cross-site scripting (XSS), and buffer overflows. It offers an interactive UI plugin so that developers can review and fix code vulnerabilities within their IDE. This tool is not well suited for the code review lifecycle, as it does not integrate with the pull request interfaces, nor with other code review tools.
CodeSonar
CodeSonar is a commercial tool that uses data flow analysis to identify potential issues in C, C++, Java, Kotlin, JavaScript and Python code. It can analyze both, source code and binaries. It uses a proprietary analysis engine to identify issues such as buffer overflows, null pointer dereferences, and use-after-free errors, and thus provides deep SAST (static application security testing) integration that is compliant with a range of safety and coding standards.
Coverity
Coverity was the largest public-private sector research project initiated with the U.S. Department of Homeland Security, with the aim to improve the security of open-source software. Nowadays, the project is managed by Synopsys, and still offers a free service to open-source projects.
FindBugs and SpotBugs
FindBugs is a well-known open-source tool that uses data flow analysis to identify potential issues in Java code. It’s a pretty old, and now abandoned tool, yet there is also a new “spiritual” successor called SpotBugs. It uses a range of techniques to identify issues such as null pointer dereferences, resource leaks, and threading issues.
Conclusion
Static and dynamic analysis tools that automate the code review process like DeepSource, Codacy, or Synk offer several benefits during code reviews. They help identify potential bugs, security vulnerabilities, and performance issues in the code, and offer coding standards checks to ensure the code follows best practices. By using these tools, you can save time, reduce the risk of introducing bugs, and standardize the review process, ensuring consistency across the codebase.
Yet, static analysis tools are not the only automation that can be super helpful during code reviews. With the advances in AI brought to you by large language models such as GPT or Gemini, a set of new AI-powered code review tools came into existence. These AI code reviewers are super useful and can speed up code reviewing and improve code quality, so make sure to check them out. Also have a look at the 10 best code review tools to streamline your code review lifecycle.
